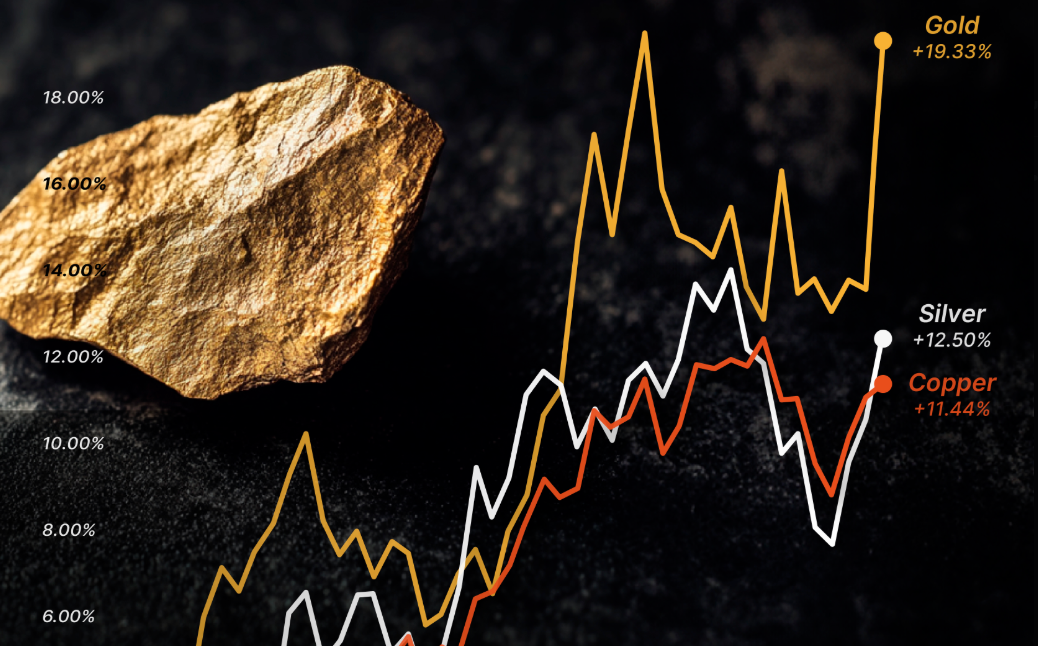
- Gold, silver, and copper have all surged to record highs, outperforming stocks.
- Gold has beaten the S&P 500 for six straight months, silver has crossed $90 per ounce, and copper is up roughly 40% in six months.
- The synchronized metals rally suggests investors are hedging against economic uncertainty.
Precious and industrial metals are flashing a major warning about the global economy. Gold, silver, and copper have all hit record levels in recent trading, outperforming stocks and pointing to growing investor concerns over currency stability, inflation, and policy risks.
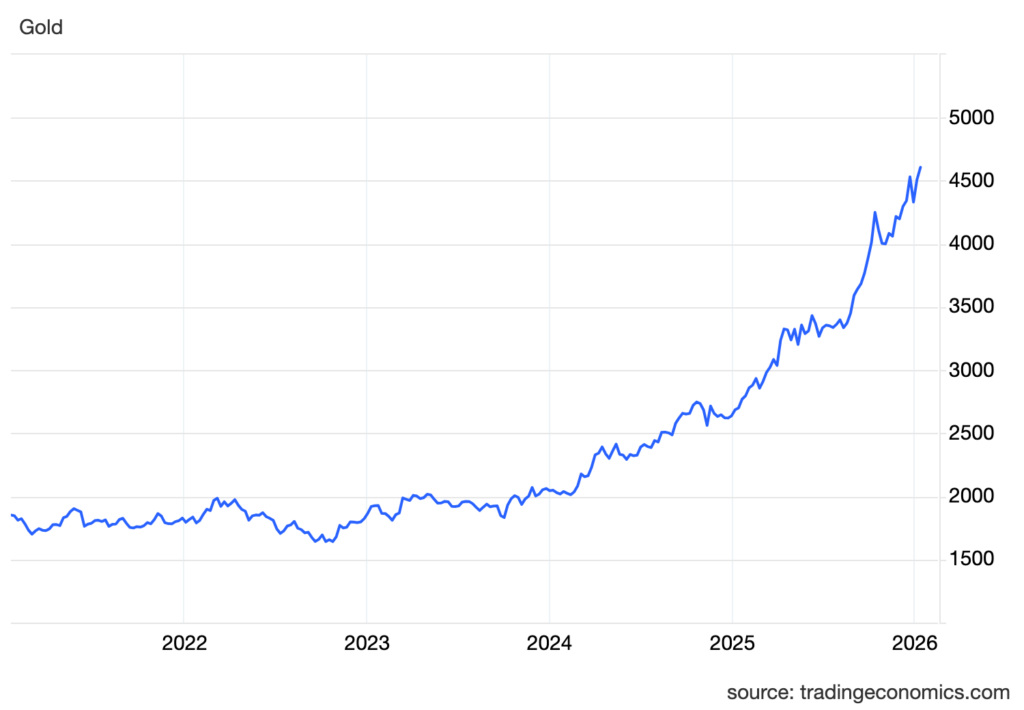
Gold recently touched a new all-time high near $4,640 per ounce. It has now beaten the S&P 500 for six straight months, the longest such streak since the Global Financial Crisis.
Silver also broke above $90 per ounce for the first time ever, pushing its total market value above $5 trillion. Meanwhile, copper has climbed roughly 40% in just six months and continues to set fresh records.

Analysts say this synchronized rally across real assets is not simply about growth optimism. Instead, it reflects widespread hedging against a weakening U.S. dollar, persistent inflation, and heightened geopolitical tensions.
Why Is Gold Price Climbing?
Several clear factors are driving gold’s strength:
- Weakening U.S. Dollar – A softer dollar makes gold cheaper for foreign buyers.
- Rising U.S. Treasury Yields – Investors seek safe havens when bond yields signal stress.
- Persistent Inflation – Gold retains value better than cash during price surges.
- Strong Central Bank Buying: Major central banks continue adding gold reserves.
- Geopolitical Risks – Ongoing global conflicts push demand for reliable stores of value.
- Gold ETF Inflows – Institutional and retail investors are pouring money into gold funds.
These drivers have combined to create powerful upward momentum for the yellow metal.
Copper Breaks Out to New All-Time High
Copper, often called “Dr. Copper” for its ability to predict economic health, is also making headlines. The metal hit a fresh record of $6.06 per pound in overnight trading, with no immediate signs of reversal.
Demand from electric vehicles, renewable energy infrastructure, data centers, and artificial intelligence projects continues to outstrip supply. Mining disruptions and years of underinvestment in new capacity have tightened the market further.
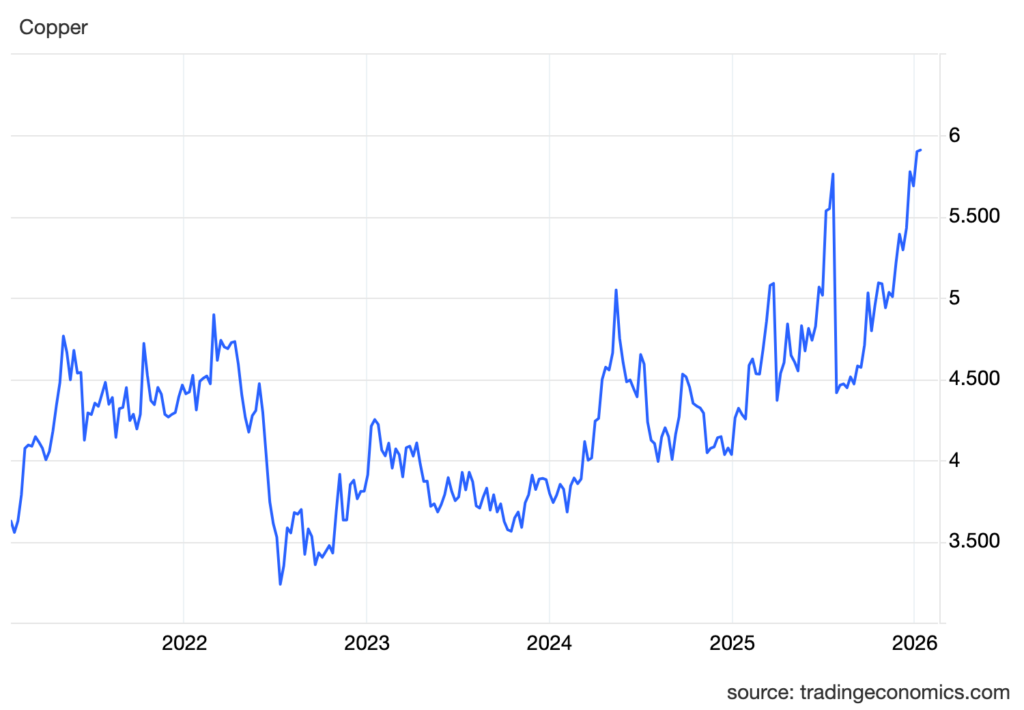
The latest Binance TradingView chart for copper shows a steep parabolic advance. Price has broken decisively above previous resistance near $5.50–$5.80, with strong volume supporting the move to $6.06.
The chart displays a clear uptrend channel, with higher highs and higher lows intact. Momentum indicators remain elevated but have not yet reached extreme overbought levels seen in past peaks.
Moving averages are bullish, with the 50-day well above the 200-day. Recent candles show long green bodies and minimal upper wicks, indicating buyers remain firmly in control.
There is little technical evidence of exhaustion at this stage. A pullback to the $5.70–$5.90 zone could offer support if profit-taking emerges, but the overall structure suggests the path of least resistance is still higher.
When gold, silver, and copper rally together like this, markets are typically pricing in more than just growth. Investors appear to be protecting wealth against currency debasement, unpredictable policy shifts, and eroding confidence in traditional financial assets.
The message from metals is clear: uncertainty remains high, and real assets are regaining favor as a hedge.
What’s your Reaction?
+1
1

+1
0

+1
0

+1
0
+1
0

+1
0

+1
0